
Showing posts with label Trading Strategy. Show all posts
Showing posts with label Trading Strategy. Show all posts
Trading Strategy
EURUSD
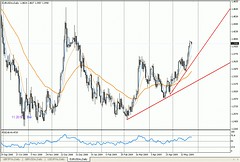
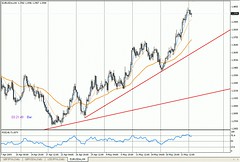
This week for EURUSD, I am thinking for bullish now. But I'll wait for good entry. RSI looks overbought and prices is far away from trendline, I will buy if prices touch trenline and use candlestick chart pattern at H4 for confirmation.
USDJPY
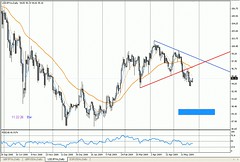
This pair is still downtrend because of head and shoulders pattern. Prices should go to 89.00-90.00 if we use head and shoulders for determining taking-profit (TP). Just looking for selling this pair.
GBPUSD
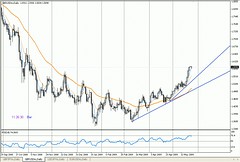
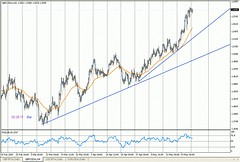
This pair likes chart of EURUSD this week. So, I am gonna buy for this pair but still waiting for good entry. I consider for buying when prices touch trendline and use candlestick chart pattern at H4 for confirmation.
GBPJPY
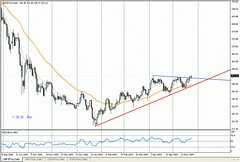
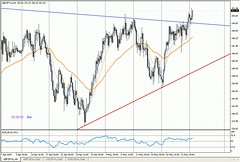
Upper trendline had broken last friday. I am thinking for bullish now. But honestly I do not know where is level I want to take for entry.
Today, I am not trading now because of Memorial Day at USA. I think prices don't move too much (low volatility). read more...
Trading Strategy
GBPJPY
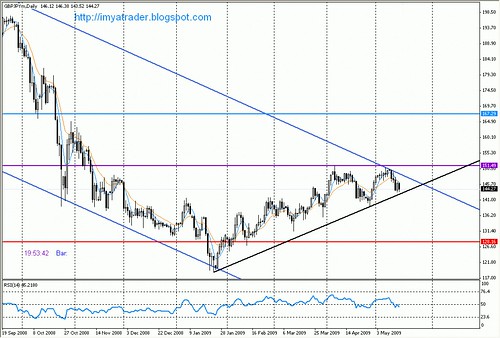
My trading journal for next week, I use same chart with this week at GBPJPY.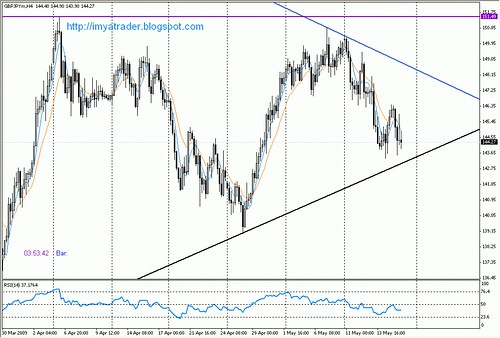
My trading plan:
- SELL, when prices break black trendline and close below it at daily. I use red-line for target.
- BUY, when prices break down-channel and stay above that at weekly. I recommend that price close above purple line for confirmation. I use blue-horizontal line for target.
GBPUSD
I like GBPUSD this week, I saw head and shoulders and price retraced at 38.2 at H4 yesterday. I've sold this pair at 15 May 2009 16.25 GMT, check my other post today.EURUSD
Next week EURUSD can be in ranging. I see ascending triangle can be formed.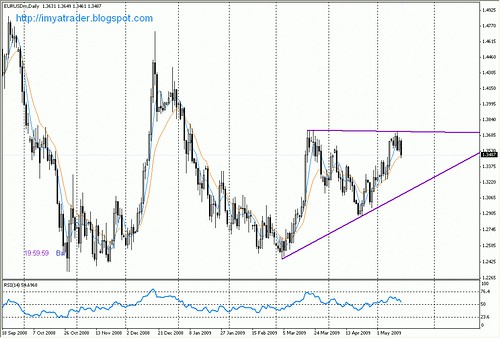
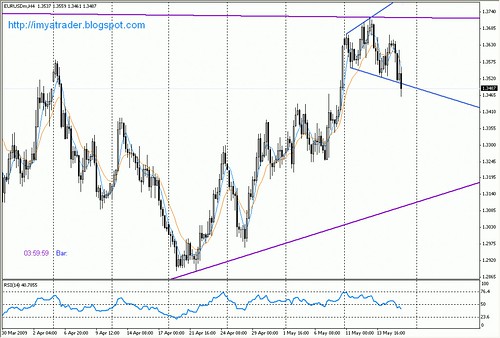
Trading plan:
- SELL, price had closed below channel at H4. I think price will go south next week
- BUY, if price close above resistance line, I consider to buy at this pair.
- Until this pattern (ascending triangle) breaks out, just buy when price touch support line and sell when touch resistance line. I use candlestick pattern at H4 as confirmation.
USDJPY
I see reversal pattern (head and shoulders) this week for this pair and prices had closed below trendline. I think USDJPY will be in bearish next week.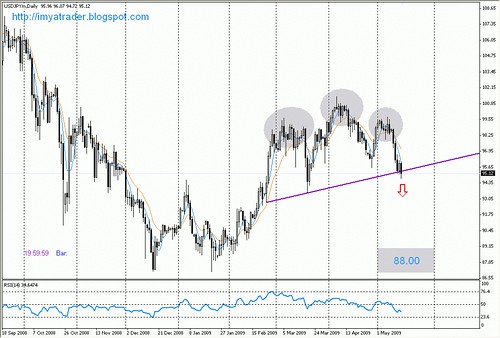
Trading plan:
I just think to sell USDJPY next week. If next week prices still close below trendline, I'll consider to sell it.
Trading Strategy
read more...Trading Strategy
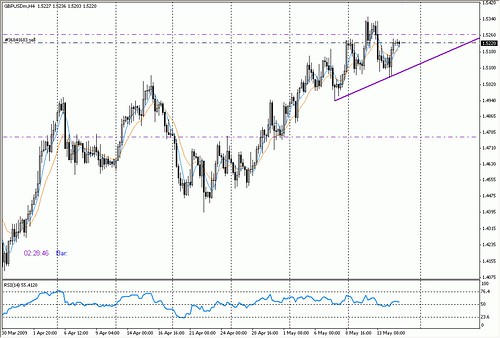
Chart Pattern (GBPUSD, USDJPY)
I see two chart patterns today. They are head and shoulders (reversal chart pattern) at GBPUSD and USDJPY.Charts are below :
Trading Strategy
read more...Trading Strategy
GBPJPY
My trading journal this week is not different with my review last week.But I have modified down-channel at daily chart to get better channel.
From charts below, I see that trend is still downtrend and then I am still waiting for confirmation @ H4 to set up short entry. If direction is changed, I have buy setup above purple line.
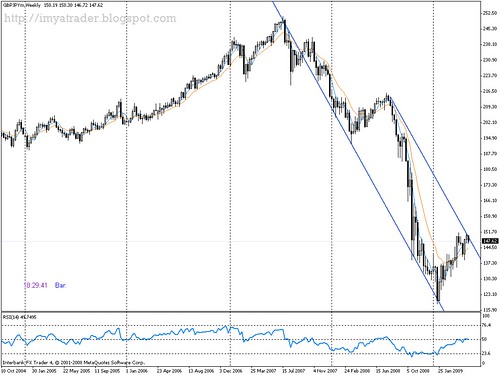
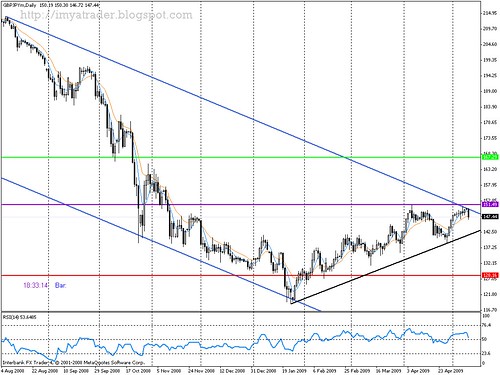
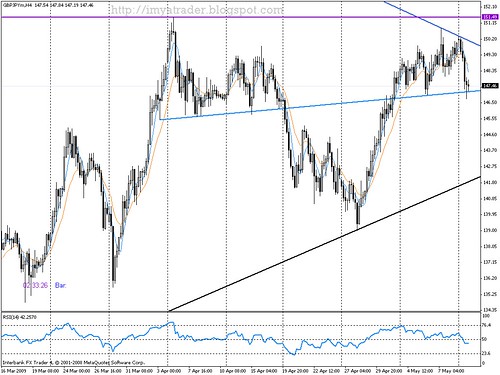
Trading Plan :
- Sell when prices close below blue-trend line @ H4.
- Buy, if direction is changed and prices go to north, buy when prices close above purple-line @ daily.
- Set stoploss as I can find support or resistance area @ H4 and set my target @ lime-line (167.29) for buying and set @ red-line (128.16) for selling.
Trading Strategy
read more...Trading Strategy
GBPJPY
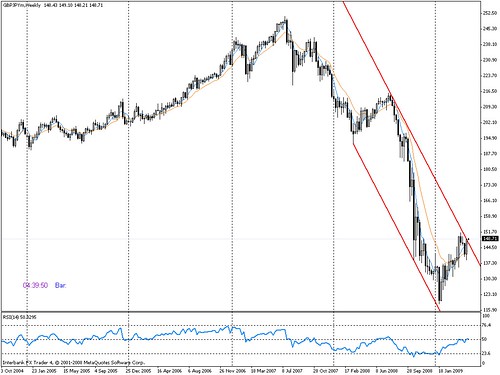
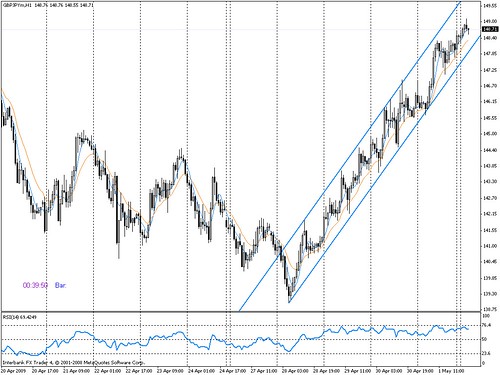
Trading Journal this week...If we see chart at weekly, we know that trend is still downtrend.
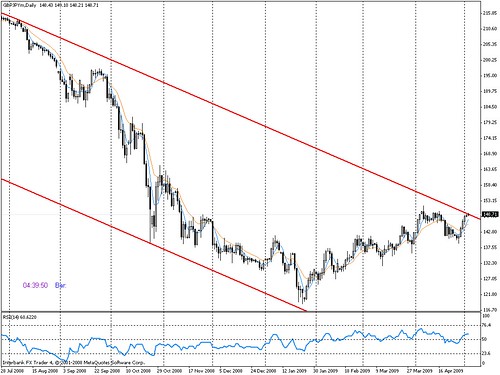
Now, prices are still below upper channel.
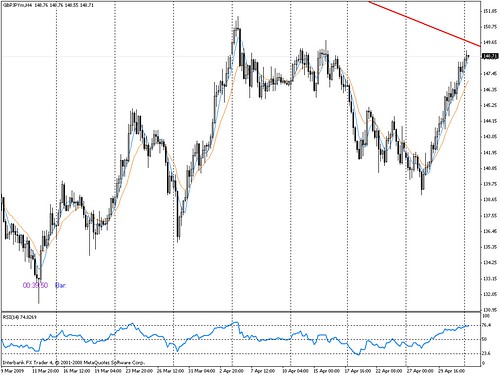
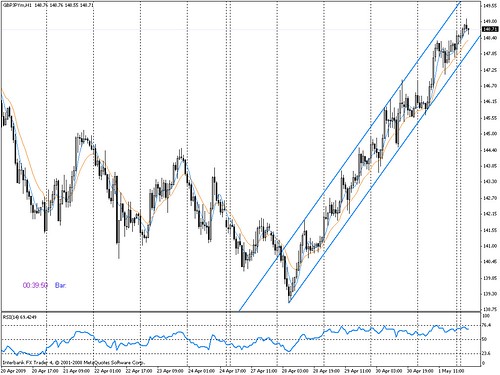
At smaller time frames like H4, H1, and M30 we can see there is bearish divergence.
Trading Plan :
Now, I am trying to make short entry and still waiting for good time to entry. I think there is good time to sell when lower channel at H1 and M30 is break out.
But, I should wait for completed candlestick pattern at daily chart. I will wait for next days to avoid false-breakout and search good stoploss for entry.
Trading Strategy
read more...Trading Strategy
GBPJPY
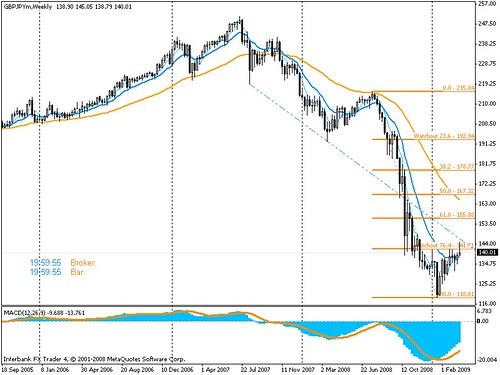
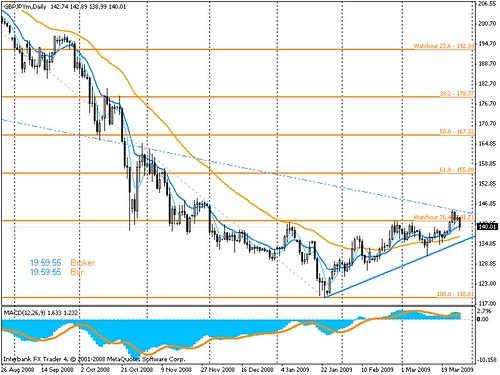
This Trading Journal is taken from my other's blog.This week, prices loss its power again to close above 141.71. Altough at daily (D1) prices can close above that level but at weekly prices closed @ 140.01 and makes false-breakout at weekly chart.
Based on analysis above, trend can go down and touch support-line.
Trading plan :
- Ranging, prices just moved between bold trendline (blue) and dotted trendline (blue). Buy when prices close above bold trendline and Sell when prices close below dotted trendline. Use candlestick pattern at H4 as confirmation.
- Breakout, Buy when prices close above dotted trendline (blue) and Sell when prices close below bold trendline (blue). It's better waiting for completed chart at weekly for confirmation to avoid false-breakout at daily.
Trading Strategy
read more...
Subscribe to:
Posts (Atom)


