Trading Strategy

GBPJPY

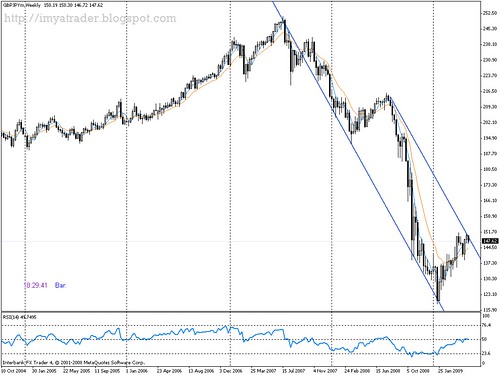
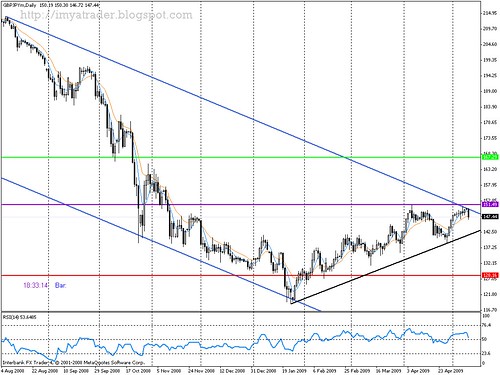
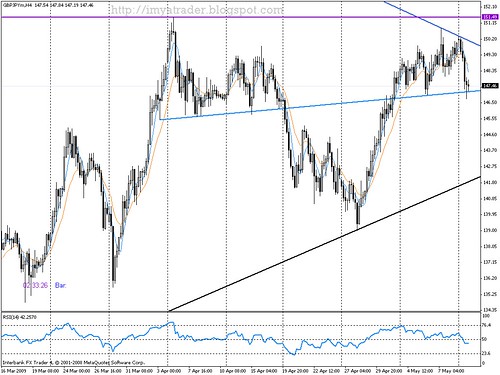
My trading journal for next week, I use same chart with this week at GBPJPY.
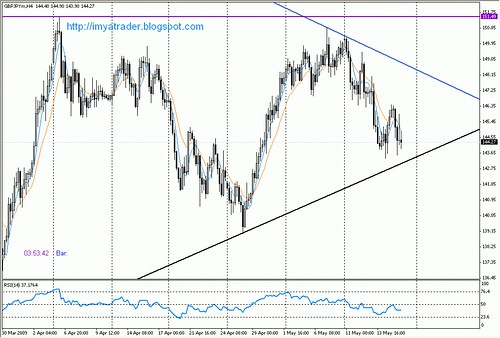
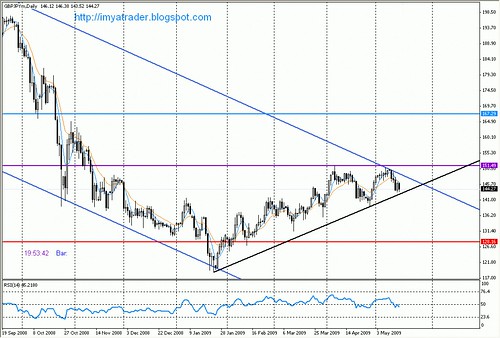
160509gbpjpyh4

160509gbpjpyd1
My trading plan:
  • SELL, when prices break black trendline and close below it at daily. I use red-line for target.
  • BUY, when prices break down-channel and stay above that at weekly. I recommend that price close above purple line for confirmation. I use blue-horizontal line for target.
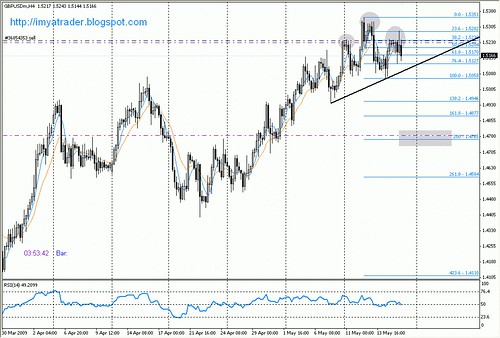
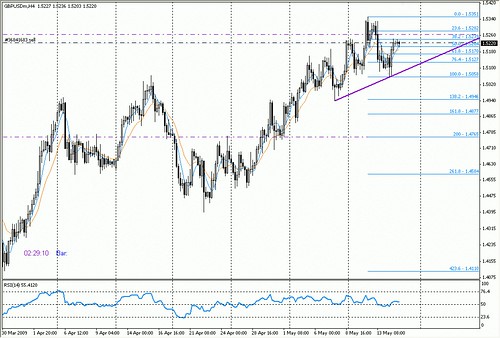
GBPUSD

I like GBPUSD this week, I saw head and shoulders and price retraced at 38.2 at H4 yesterday. I've sold this pair at 15 May 2009 16.25 GMT, check my other post today.

EURUSD

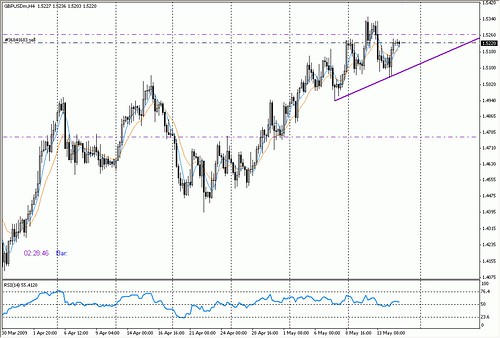
Next week EURUSD can be in ranging. I see ascending triangle can be formed.
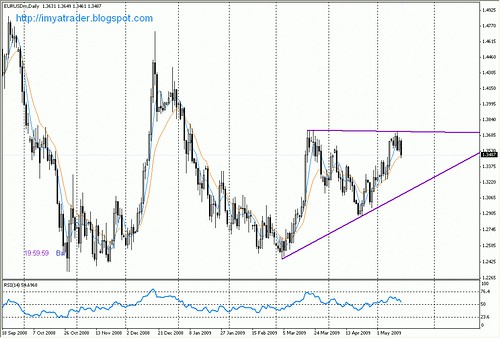
 160509eurusdd1

160509eurusdh4
Trading plan:
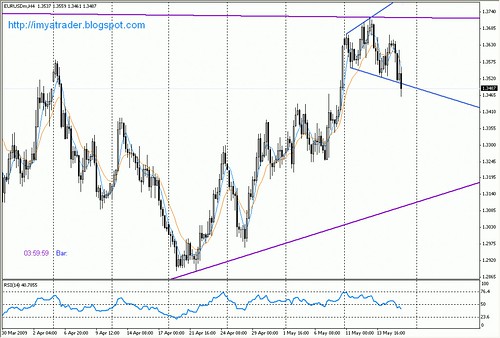
  • SELL, price had closed below channel at H4. I think price will go south next week
  • BUY, if price close above resistance line, I consider to buy at this pair.
  • Until this pattern (ascending triangle) breaks out, just buy when price touch support line and sell when touch resistance line. I use candlestick pattern at H4 as confirmation.
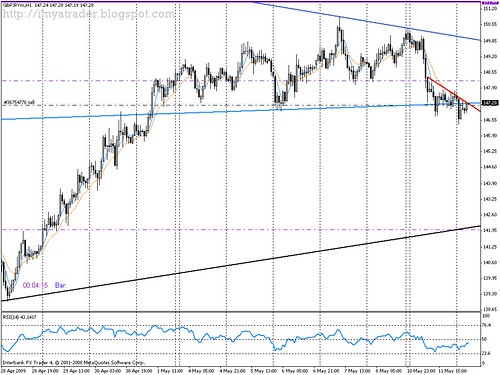
USDJPY

I see reversal pattern (head and shoulders) this week for this pair and prices had closed below trendline. I think USDJPY will be in bearish next week.
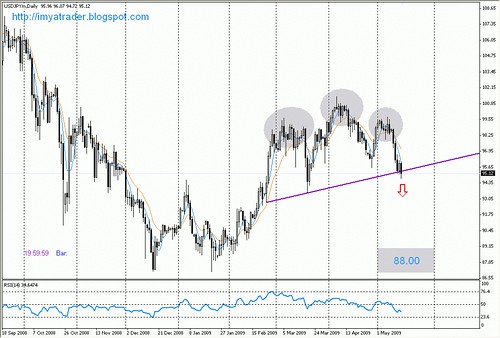
 160509usdjpyd1
Trading plan:
I just think to sell USDJPY next week. If next week prices still close below trendline, I'll consider to sell it.

Trading Strategy

read more...

Trading Journal (GBPUSD)

I've short again GBPUSD @1.5240, SL @1.5230 (BEP + 10 pips), TP @1.4785 (near 1.4765 fibonacci retracement 200.0), 16.25 GMT
My reasons are:

  • There is reversal pattern, head and shoulders.
  • I see several dojis @H4.
  • Prices retrace at 38.2 and 23.6 Fibonacci Retracement.

160509gbpusdh4entry
Closed with profit +10 pips at 18 May 2009 08.20 GMT

Trading Journal

read more...

Trading Journal (GBPUSD)

I've short GBPUSD @1.5225, SL @1.5265, TP @1.4765, 05:37 GMT
My reasons are:

  • There is reversal pattern, head and shoulders.
  • I see doji.
  • Prices retrace at 38.2 Fibonacci Retracement.

150509gbpusdh4entry
Closed with lost -0 pips 12.48 GMT (I moved SL to BEP when I saw doji at H1 10.00 GMT)

Trading Journal

read more...

Trading Strategy

Chart Pattern (GBPUSD, USDJPY)

I see two chart patterns today. They are head and shoulders (reversal chart pattern) at GBPUSD and USDJPY.

Charts are below :
150509gbpusdh4 150509gbpusdh4

Trading Strategy

read more...

Daily Pivot Points

S3 S2 S1 P R1 R2 R3
EUR/USD 1.34291.34771.35531.36011.36771.37251.3801
USD/JPY 94.2494.6795.3295.7596.4096.8397.48
GBP/USD 1.49181.49881.51051.51751.52921.53621.5479
GBP/JPY 141.08142.21144.16145.29147.24148.37150.32

Weekly Pivot Points

S3 S2 S1 P R1 R2 R3
EUR/USD 1.29021.30571.33451.35001.37881.39431.4231
USD/JPY 96.0296.9797.8598.8099.68100.63101.51
GBP/USD 1.45491.46911.49521.50941.53551.54971.5758
GBP/JPY 143.87145.41147.80149.34151.74153.27155.67

Monthly Pivot Points

S3 S2 S1 P R1 R2 R3
EUR/USD 1.21951.25401.28921.32371.35891.39341.4286
USD/JPY 90.0392.8295.8598.64101.67104.46107.49
GBP/USD 1.35661.39191.43601.47131.51541.55071.5948
GBP/JPY 127.25133.12139.75145.62152.25158.12164.75
Note:

Pivot points are very useful tools that use the previous bars' highs, lows and closings to project support and resistance levels for future bars. Daily pivot points are useful for swing trading. Longer term pivot points provide an idea of where key support and resistance levels should be. Place the pivot points on your charts and see how traders appear to give pivot point levels a lot of respect. Daily pivots are calculated from previous day's high, low, close which ends at 24.00 GMT.

read more...

Daily Pivot Points

S3 S2 S1 P R1 R2 R3
EUR/USD 1.32881.34111.34761.35991.36641.37871.3852
USD/JPY 93.2194.1694.7795.7396.3397.2997.89
GBP/USD 1.47691.49271.50151.51731.52611.54191.5507
GBP/JPY 138.40141.14142.59145.33146.78149.52150.97

Weekly Pivot Points

S3 S2 S1 P R1 R2 R3
EUR/USD 1.29021.30571.33451.35001.37881.39431.4231
USD/JPY 96.0296.9797.8598.8099.68100.63101.51
GBP/USD 1.45491.46911.49521.50941.53551.54971.5758
GBP/JPY 143.87145.41147.80149.34151.74153.27155.67

Monthly Pivot Points

S3 S2 S1 P R1 R2 R3
EUR/USD 1.21951.25401.28921.32371.35891.39341.4286
USD/JPY 90.0392.8295.8598.64101.67104.46107.49
GBP/USD 1.35661.39191.43601.47131.51541.55071.5948
GBP/JPY 127.25133.12139.75145.62152.25158.12164.75
Note:

Pivot points are very useful tools that use the previous bars' highs, lows and closings to project support and resistance levels for future bars. Daily pivot points are useful for swing trading. Longer term pivot points provide an idea of where key support and resistance levels should be. Place the pivot points on your charts and see how traders appear to give pivot point levels a lot of respect. Daily pivots are calculated from previous day's high, low, close which ends at 24.00 GMT.

read more...

Daily Pivot Points

S3 S2 S1 P R1 R2 R3
EUR/USD 1.34471.35051.35901.36481.37331.37911.3876
USD/JPY 93.6994.8395.5396.6897.3898.5299.22
GBP/USD 1.48441.49581.51231.52371.54021.55161.5681
GBP/JPY 142.63144.46145.80147.63148.97150.80152.14

Weekly Pivot Points

S3 S2 S1 P R1 R2 R3
EUR/USD 1.29021.30571.33451.35001.37881.39431.4231
USD/JPY 96.0296.9797.8598.8099.68100.63101.51
GBP/USD 1.45491.46911.49521.50941.53551.54971.5758
GBP/JPY 143.87145.41147.80149.34151.74153.27155.67

Monthly Pivot Points

S3 S2 S1 P R1 R2 R3
EUR/USD 1.21951.25401.28921.32371.35891.39341.4286
USD/JPY 90.0392.8295.8598.64101.67104.46107.49
GBP/USD 1.35661.39191.43601.47131.51541.55071.5948
GBP/JPY 127.25133.12139.75145.62152.25158.12164.75
Note:

Pivot points are very useful tools that use the previous bars' highs, lows and closings to project support and resistance levels for future bars. Daily pivot points are useful for swing trading. Longer term pivot points provide an idea of where key support and resistance levels should be. Place the pivot points on your charts and see how traders appear to give pivot point levels a lot of respect. Daily pivots are calculated from previous day's high, low, close which ends at 24.00 GMT.

read more...

Trading Journal (GBPJPY)

I've short GBPJPY @147.20, SL @148.20, TP @142.50 (S3 Daily Pivot Points)
My reasons are:

  • Main trend is downtrend.
  • Prices have touched red-trendline @H1 and prices closed below it.
  • Blue-trendline has been broken @H4 and prices closed below it.

120509h1entry
Closed with lost -100pips

Trading Journal

read more...

Daily Pivot Points

S3 S2 S1 P R1 R2 R3
EUR/USD 1.34301.34961.35731.36031.36491.37131.3759
USD/JPY 95.4396.3496.9797.8898.5199.42100.05
GBP/USD 1.48661.49671.50431.51441.52201.53211.5397
GBP/JPY 142.50144.61146.08148.19149.66151.77153.24

Weekly Pivot Points

S3 S2 S1 P R1 R2 R3
EUR/USD 1.29021.30571.33451.35001.37881.39431.4231
USD/JPY 96.0296.9797.8598.8099.68100.63101.51
GBP/USD 1.45491.46911.49521.50941.53551.54971.5758
GBP/JPY 143.87145.41147.80149.34151.74153.27155.67

Monthly Pivot Points

S3 S2 S1 P R1 R2 R3
EUR/USD 1.21951.25401.28921.32371.35891.39341.4286
USD/JPY 90.0392.8295.8598.64101.67104.46107.49
GBP/USD 1.35661.39191.43601.47131.51541.55071.5948
GBP/JPY 127.25133.12139.75145.62152.25158.12164.75
Note:

Pivot points are very useful tools that use the previous bars' highs, lows and closings to project support and resistance levels for future bars. Daily pivot points are useful for swing trading. Longer term pivot points provide an idea of where key support and resistance levels should be. Place the pivot points on your charts and see how traders appear to give pivot point levels a lot of respect. Daily pivots are calculated from previous day's high, low, close which ends at 24.00 GMT.

read more...

Trading Strategy

GBPJPY

My trading journal this week is not different with my review last week.
But I have modified down-channel at daily chart to get better channel.
From charts below, I see that trend is still downtrend and then I am still waiting for confirmation @ H4 to set up short entry. If direction is changed, I have buy setup above purple line.
120509w1 120509d1 120509h4
Trading Plan :
  • Sell when prices close below blue-trend line @ H4.
  • Buy, if direction is changed and prices go to north, buy when prices close above purple-line @ daily.
  • Set stoploss as I can find support or resistance area @ H4 and set my target @ lime-line (167.29) for buying and set @ red-line (128.16) for selling.

Trading Strategy

read more...