Trading Strategy
GBPJPY
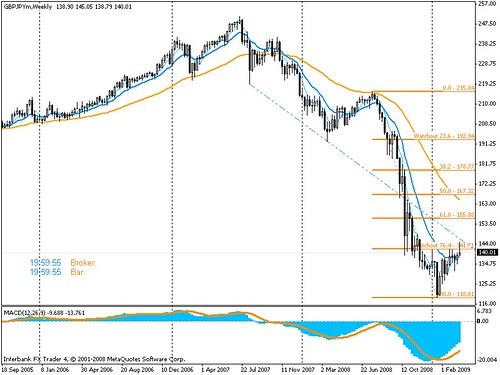
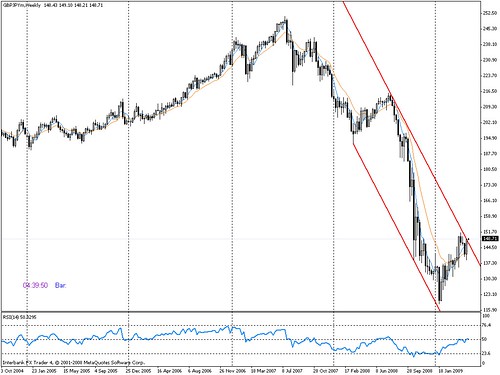
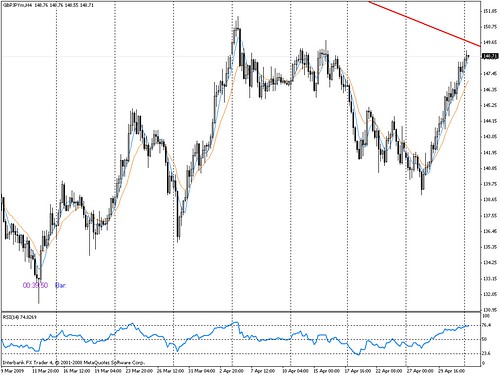
Trading Journal this week...If we see chart at weekly, we know that trend is still downtrend.
Now, prices are still below upper channel.
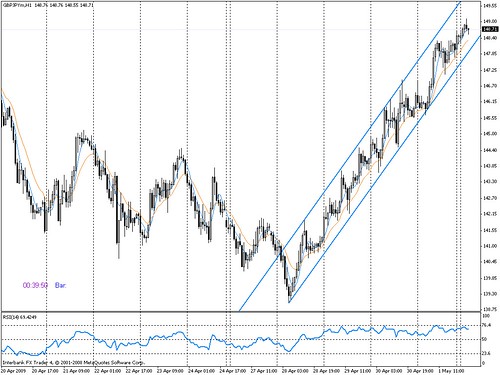
At smaller time frames like H4, H1, and M30 we can see there is bearish divergence.

Trading Plan :
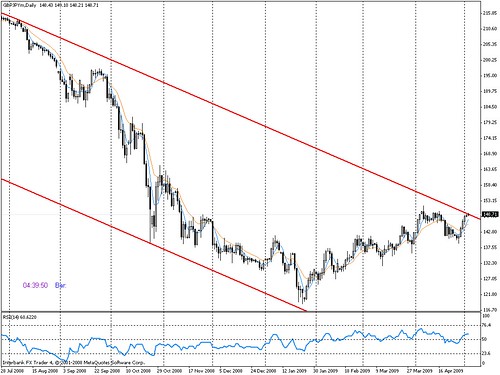
Now, I am trying to make short entry and still waiting for good time to entry. I think there is good time to sell when lower channel at H1 and M30 is break out.
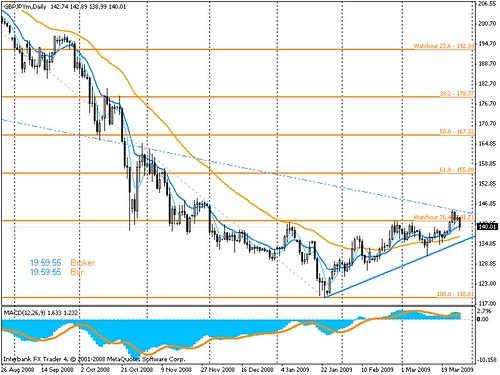
But, I should wait for completed candlestick pattern at daily chart. I will wait for next days to avoid false-breakout and search good stoploss for entry.